
How to Backtest On Tradingview
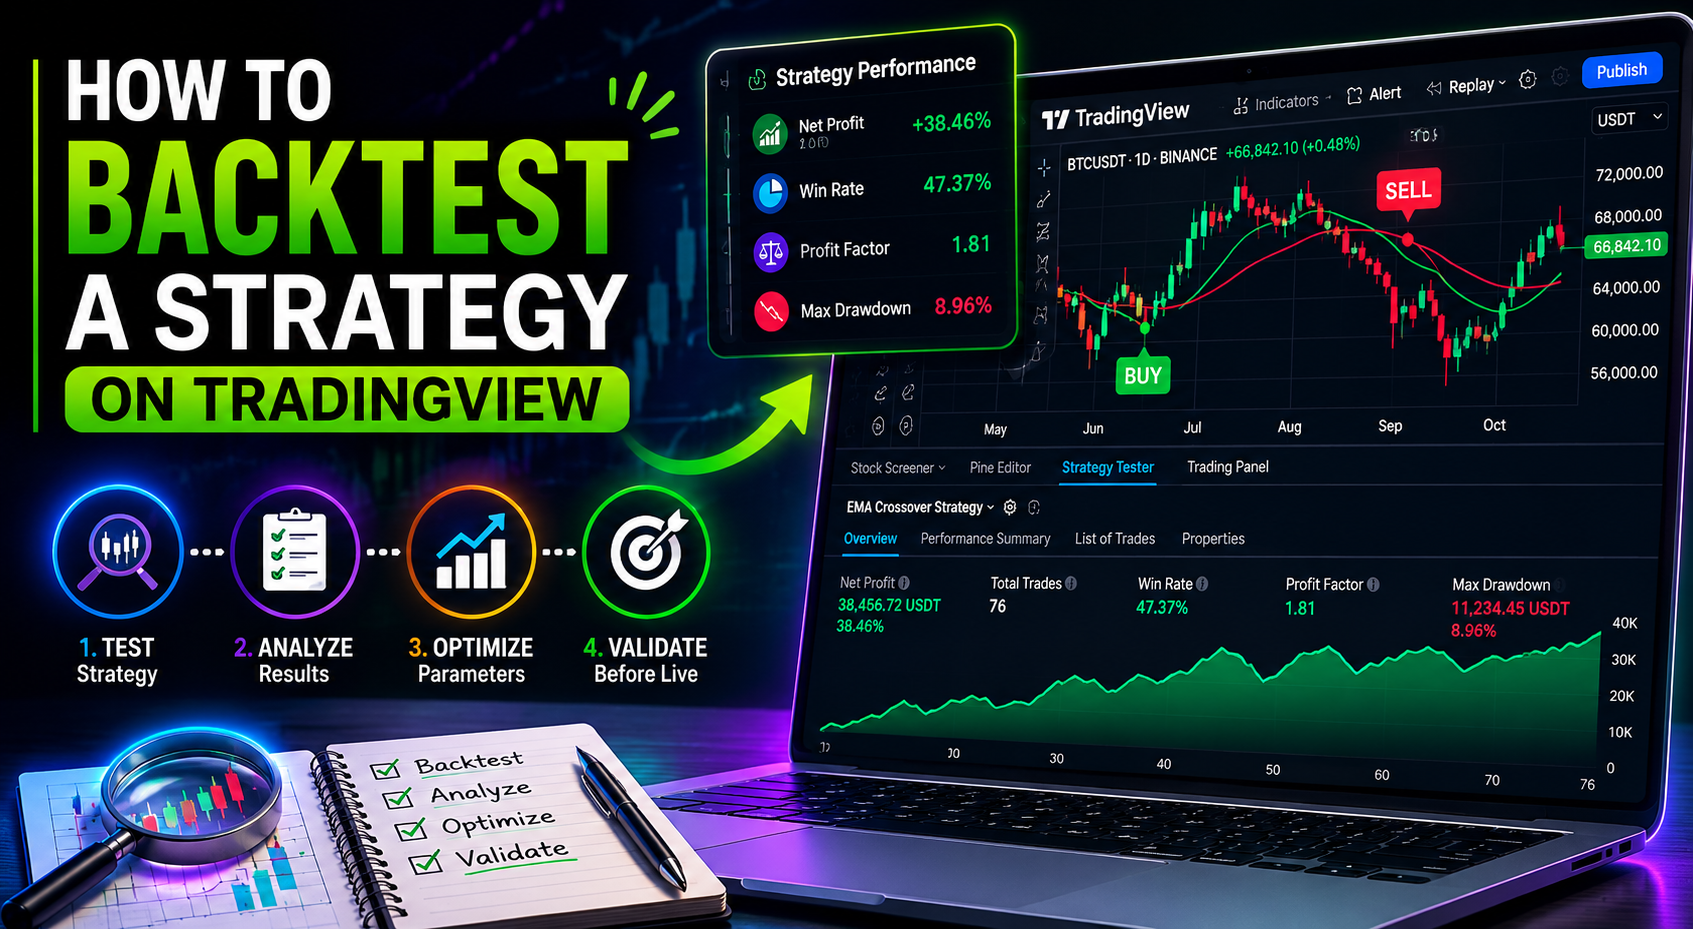
How to Backtest a Strategy on TradingView
Backtesting helps traders evaluate how a trading strategy would have performed using historical market data.
Using TradingView, traders can test strategies before risking real money. This is one of the most important steps before automating a strategy .
A proper backtest helps you understand:
- Profitability
- Win rate
- Drawdowns
- Risk-to-reward ratio
- Strategy consistency
- Market behavior
What Is Backtesting?
Backtesting means applying a trading strategy to past price data to see how it would have performed historically.
Instead of guessing whether a strategy works, backtesting provides measurable performance data.
Example:
“If I used this EMA crossover strategy on BTC for the last 2 years, would it have made money?”
TradingView can answer that automatically.
Why Backtesting Is Important
Before automating trades or using copy trading, you should validate your strategy first.
Backtesting helps traders:
- Avoid weak strategies
- Improve entry/exit rules
- Understand risk
- Optimize parameters
- Build confidence before live trading
What You Need Before Starting
Requirements
- A TradingView account
- A trading strategy
- Historical chart data
- Basic understanding of indicators or Pine Script
Step 1 — Open TradingView
Visit:
Open the chart of the asset you want to test.
Examples:
- BTCUSDT
- ETHUSDT
- SOLUSDT
Step 2 — Open the Strategy Tester
At the bottom panel of TradingView:
Click:
Strategy Tester
This is where TradingView displays:
- Profit/loss
- Win rate
- Drawdown
- Total trades
- Performance metrics
Step 3 — Add a Strategy
There are 2 ways to backtest.
Option 1 — Use Built-In Strategies
TradingView provides prebuilt strategies.
Go to:
Indicators → Strategies
Examples:
- Moving Average Cross
- Bollinger Bands Strategy
- Supertrend Strategy
- MACD Strategy
Click any strategy to apply it to the chart.
TradingView instantly starts backtesting.
Option 2 — Use Pine Script Strategy
Advanced traders can create custom strategies using Pine Script.
Example logic:
- Buy when EMA 20 crosses EMA 50
- Exit when opposite crossover happens
Once applied, TradingView automatically simulates trades.
here is the sample code for it
//@version=5
strategy("EMA Cross Strategy", overlay=true)

fastEMA = ta.ema(close, 9)
slowEMA = ta.ema(close, 21)

buySignal = ta.crossover(fastEMA, slowEMA)
sellSignal = ta.crossunder(fastEMA, slowEMA)

plot(fastEMA, color=color.green)
plot(slowEMA, color=color.red)

if (buySignal)
    strategy.entry("BUY", strategy.long)

if (sellSignal)
    strategy.close("BUY")
Step 4 — Analyze the Results
TradingView now shows historical performance.
Key metrics include:
| Metric | Meaning |
|---|---|
| Net Profit | Total profit generated |
| Win Rate | Percentage of profitable trades |
| Profit Factor | Gross profit ÷ gross loss |
| Max Drawdown | Largest portfolio decline |
| Total Trades | Number of trades taken |
| Average Trade | Average PnL per trade |
Important Metrics to Focus On
Win Rate
Higher win rate is not always better.
A 40% win rate strategy can still be profitable with good risk management.
Max Drawdown
This shows the worst losing phase.
Lower drawdown generally means safer strategies.
Profit Factor
A healthy profit factor is usually:
\text{Profit Factor} = \frac{\text{Gross Profit}}{\text{Gross Loss}}
Generally:
- Above 1 = profitable
- Above 1.5 = good
- Above 2 = strong
Risk-to-Reward Ratio
This compares average profit to average loss.
\text{Risk Reward Ratio} = \frac{\text{Average Profit}}{\text{Average Loss}}
Step 5 — Change Timeframes
A strategy may behave differently across timeframes.
Test on multiple charts:
- 5 minute
- 15 minute
- 1 hour
- 4 hour
- Daily
This helps determine consistency.
Step 6 — Test Different Market Conditions
Always test strategies during:
- Bull markets
- Bear markets
- Sideways markets
- High volatility periods
A strategy that only works during bullish markets may fail later.
Step 7 — Optimize Parameters Carefully
You can improve results by adjusting settings.
Examples:
| Parameter | Example |
|---|---|
| EMA Length | 20 → 50 |
| RSI Level | 30 → 25 |
| ATR Multiplier | 2 → 3 |
But avoid:
❌ Over-optimization
If a strategy is “perfect” only on historical data, it may fail in live markets.
Example Backtest Workflow
Strategy
EMA Crossover
Rules
Buy when:
EMA_{20} > EMA_{50}
Sell when:
EMA_{20} < EMA_{50}
Backtest Results
| Metric | Example |
|---|---|
| Net Profit | +38% |
| Win Rate | 47% |
| Profit Factor | 1.8 |
| Max Drawdown | 11% |
This suggests the strategy may be viable for further testing.
Common Backtesting Mistakes
1. Ignoring Fees
Real trading includes:
- Exchange fees
- Funding fees
- Slippage
Always account for costs.
2. Using Too Little Data
Testing only 1 month of data is unreliable.
Prefer:
- 1–3 years of data
- Multiple market cycles
3. Curve Fitting
Over-optimized strategies often fail live.
Keep strategies simple and robust.
4. Ignoring Drawdowns
A profitable strategy with huge drawdowns may still be dangerous.
When Should You Automate a Strategy?
You should consider automation on MIRRORPIP only after:
✅ Consistent backtest results
✅ Risk management setup
✅ Paper trading validation
✅ Proper alert configuration
Final Thoughts
Backtesting is one of the most critical parts of systematic trading.
Using TradingView, traders can:
- Validate ideas
- Improve strategies
- Measure performance
- Reduce emotional trading
- Prepare for automation
A good backtesting process helps build stronger and more reliable trading systems before deploying them live on exchanges through automation platforms like MIRRORPIP.